
Who Captures the Margin in Custom Manufacturing And Who Should?
Custom manufacturing margin is rarely split according to who does the most physical work. The originator typically captures value through design, intellectual property, and customer demand; a platform captures value by reducing the cost of finding and matching with a capable supplier; and the fulfilling shop earns from the physical production itself. Understanding how these roles capture margin helps explain why manufacturing shops often operate on thinner margins and what factors allow some suppliers to capture more value.
Introduction
The party that actually cuts, casts, or molds a custom part is rarely the party that keeps the largest share of what the customer paid for it. That's worth stating plainly before getting into where the numbers come from, because it runs against the intuition that doing the hardest, most capital-intensive, most physically real part of the work should earn the biggest cut. Across every documented value chain this piece draws on, the opposite holds: physical fabrication is consistently the lowest-margin activity, while design, branding, and increasingly the layer that matches buyers to the right shop capture disproportionately more of what's left after costs.
This isn't a complaint about fairness, and it isn't an argument that any single party is doing something wrong. It's a structural observation about custom manufacturing margin: value creation and value capture are two different things, and the gap between them is consistent enough across industries to be worth mapping deliberately rather than treated as an accident of any one company's negotiating skill. What follows traces where margin actually lands across the three parties a custom part typically passes through, and why the pattern holds even when especially when the party doing the physical work is doing it well.
Three Parties, One Part: Where Margin Actually Accrues
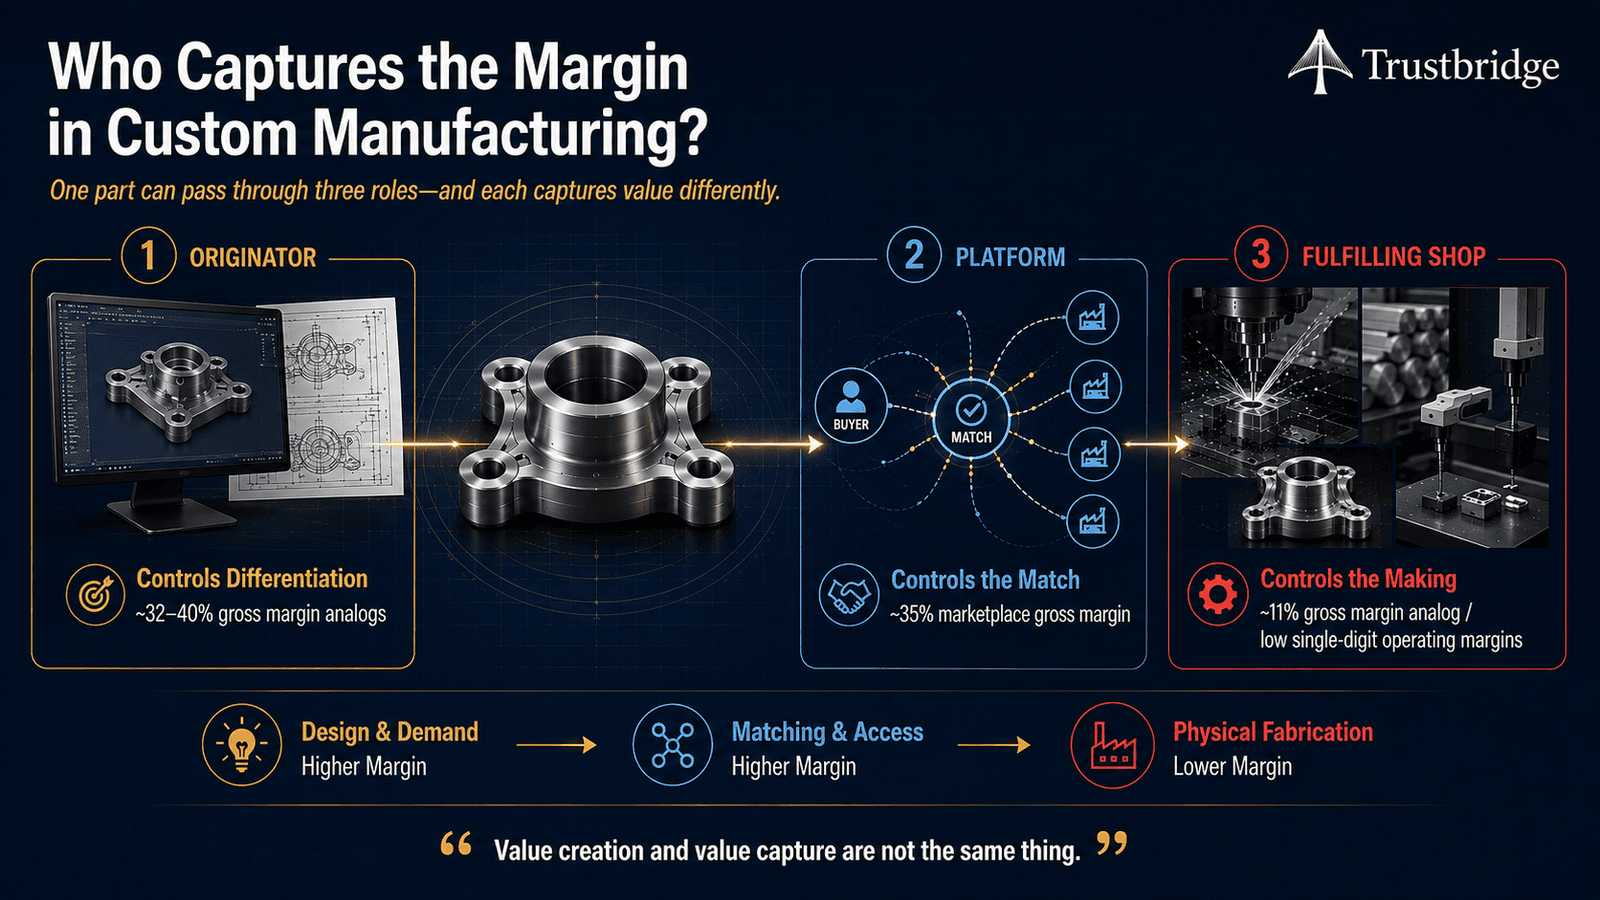
A single custom part can pass through as many as three distinct roles before it reaches whoever ultimately uses it, and each role captures margin through a different mechanism entirely. The originator designs the part, specifies what it needs to do, and puts its brand on the finished product its margin comes from differentiation and demand it controls. The platform, where one exists, doesn't touch the physical part at all; it captures margin by matching a buyer's need to a capable shop and reducing the search cost of finding one. The fulfilling shop does the part everyone pictures when they hear "manufacturing" it turns a print into a physical object, absorbs the equipment and material risk, and gets paid for that output alone. Not every part passes through all three; plenty of custom manufacturing still happens through a direct relationship between a buyer and a shop, with no platform in between at all. But wherever a platform does sit in the chain, it adds a third claim on the same pool of value the originator and the shop are already dividing between them, and that third claim doesn't come out of nowhere. The three sections below trace what public, sourceable data says about how much each role actually keeps.
The originator
The originator's margin comes from the two ends of what's sometimes called the manufacturing "smile curve" a framework proposed by Acer founder Stan Shih in 1992, built on the observation that value-added across a product's life cycle is highest at design and R&D on one end, and branding, marketing, and distribution on the other, with a dip in the middle where the physical making happens. This is the role an OEM manufacturer typically occupies: it owns the design and the customer relationship, and outsources the physical fabrication to someone else. Academic research building on the smile curve has found lead firms responsible for design, branding, and marketing in the electronics industry recording gross margins around 32%. The same body of research argues the curve isn't a fixed ratio across every industry in sectors where products obsolesce quickly and IP intensity is highest, semiconductors being the frequently cited example, the smile tends to be steeper still, with even more value concentrated at the design end and even less left in the middle. Apple offers the most publicly visible version of this pattern: its reported gross margins run close to 40%, generated almost entirely from design, software, brand, and retail categories where the originator, not the manufacturer, holds the leverage.
The platform
Where a platform sits between the originator (or any buyer) and the shop doing the work, it captures margin through matching rather than making. Xometry, a publicly traded digital marketplace for custom manufacturing, reported marketplace gross margin of 34.7% for full-year 2025, climbing above 35% in subsequent quarters a figure disclosed directly in its own investor communications, not an industry estimate. That number sits in the same range as the originator's margin above, despite the platform never operating a machine or holding material risk on a single part. The company's own investor materials attribute the expansion specifically to its pricing and sourcing algorithms improving as they accumulate more transaction data which is itself a telling detail, since it means the platform's margin grows with scale and data in a way neither the originator's brand nor the fulfilling shop's equipment naturally does. The mechanism is straightforward: reducing search and vetting costs for buyers, and distribution costs for shops, is itself a service both sides are willing to pay for, and that service scales far more cheaply than physical production does.
The fulfilling shop
The shop that actually manufactures the part sits at the bottom of this range by a wide margin. The same research citing the originator's roughly 32% found contract manufacturers specializing in assembly earning gross margins near 11%, with net margins in some estimates running negative. Foxconn, the world's largest contract electronics manufacturer, offers a concrete, publicly reported version of the same pattern: gross margins in the single-digit percentage points against Apple's near-40%, with operating margins commonly cited around 2–3%. More broadly, general manufacturing-industry benchmarks put commodity, price-taker segments — contract machining is named explicitly among them at the lower end of a 4–9% net margin range for diversified manufacturers as a whole. None of these figures are custom-manufacturing-specific job-shop data, which isn't publicly available at that granularity; they're the closest sourceable analogs, and the direction they all point is consistent.
Value Creation and Value Capture Are Not the Same Thing
None of this means the fulfilling shop creates less value than the originator or the platform if anything, the opposite is often true, since a design or a match is worth nothing without someone capable of actually producing the part to spec, on time, at the tolerance called for. What determines margin isn't how essential the work is. It's how substitutable it is, and how much leverage each party holds over the others in the relationship. That's also why the smile gets steeper in fast-obsolescing, IP-intensive sectors: the design work in those industries is genuinely harder to replicate, so its scarcity and its margin compounds, while fabrication capacity in the same sectors is usually easier to find than ever. That distinction is the actual argument this piece is making, worth separating clearly from the figures above, which only describe the pattern rather than explain why it holds so consistently across such different industries.
Why competition concentrates at the bottom
A capable shop that can hold a tolerance and hit a delivery date is, from a buyer's perspective, largely interchangeable with the next capable shop down the street which is exactly why hundreds of thousands of job shops and contract manufacturers compete on largely the same basis, and exactly why that competition compresses margin at the fulfillment end of nearly every industry examined here. Design and branding don't face the same pressure, because a buyer can't simply substitute one company's IP or reputation for another's the way they can substitute one qualified shop's spindle time for another's.
Why matching stays scarce
The platform layer captures margin comparable to the originator's for a related but distinct reason: even though many shops can make a given part, finding the right one verified, available, priced competitively, willing to take the job is its own genuinely hard problem, and solving it well at scale isn't something every buyer or every shop can easily replicate on their own. That's a different kind of scarcity than design scarcity, but it functions similarly: whoever controls the connection between buyer and shop holds leverage the shop, no matter how capable, generally doesn't hold by itself.
Why Some Shops Escape the Bottom of the Range
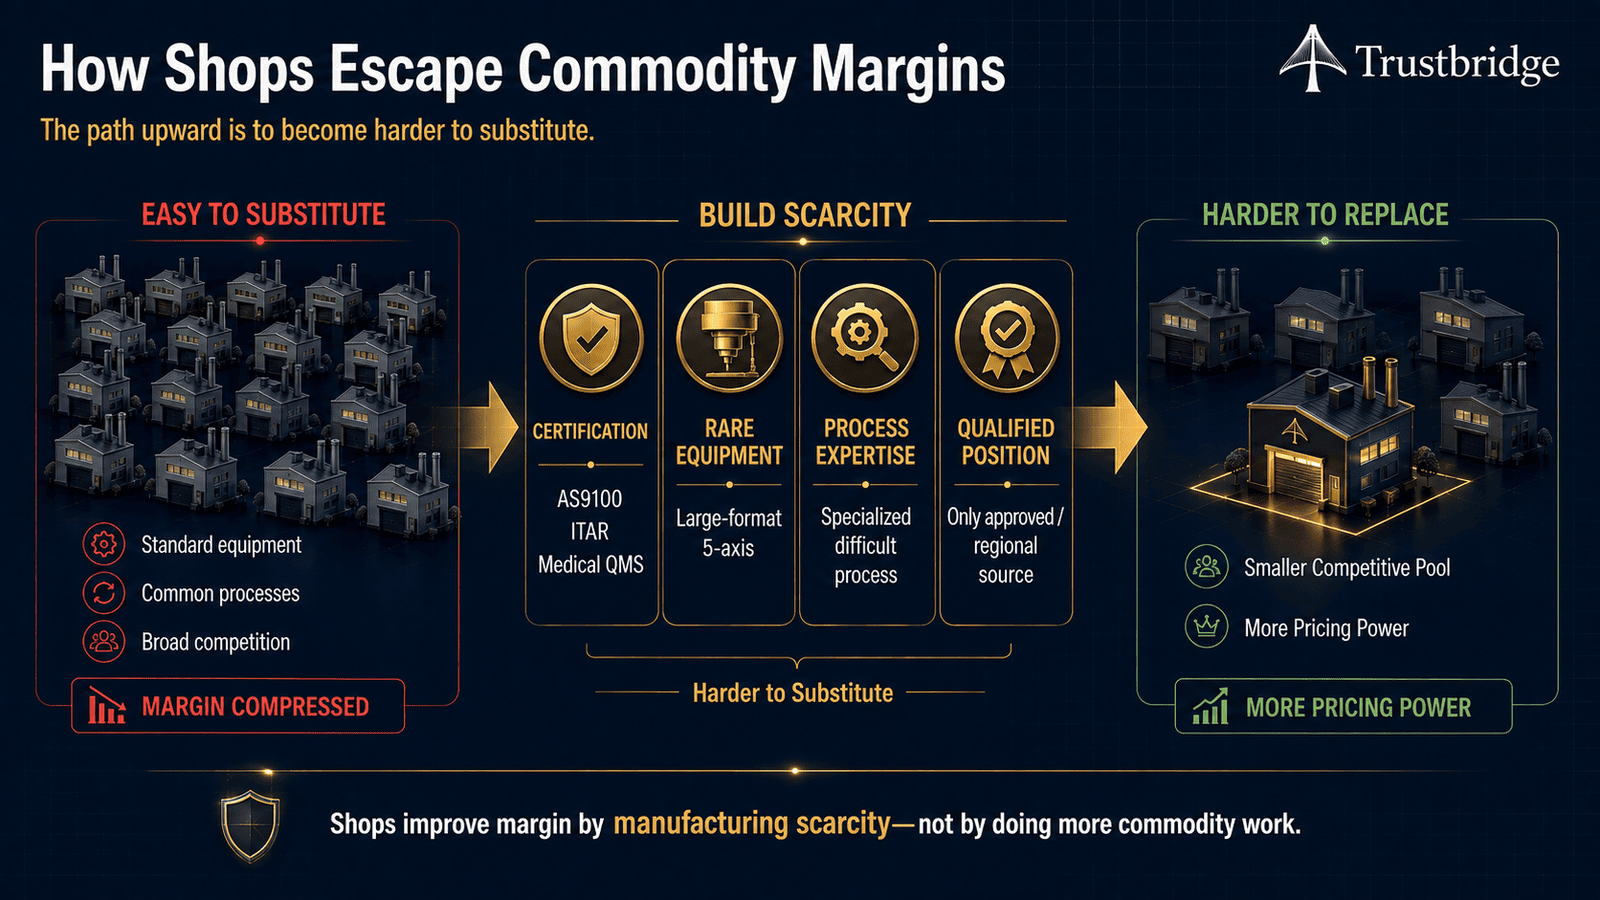
The 11% and single-digit figures above describe an average, not a hard ceiling. Some fulfilling shops consistently capture more margin than the commodity end of the range would predict, and what separates them is the same variable driving everything else in this piece: substitutability, and whether anything about a shop's position makes that substitution genuinely harder for a buyer to make. A shop holding AS9100 aerospace certification, ITAR registration, or a medical-device-specific quality system competes in a smaller pool, because buyers in those sectors are often contractually or legally required to source only from similarly qualified suppliers — a genuine barrier to entry, not a marketing claim. The same logic applies to equipment and process expertise that isn't widely duplicated: a shop with a rare large-format 5-axis capability, or the only qualified supplier for a specific process within a region, isn't competing against hundreds of interchangeable alternatives, because there often aren't hundreds of alternatives to compete against. Neither path closes the gap to an originator's or a platform's margin, and both take years and real capital to build. What they do is move a shop off the very bottom of the range — a meaningfully different position, even when it isn't a different category of business.
Conclusion
None of this is an argument that the current split is wrong, or that it should be redistributed by fiat margin follows leverage, and leverage follows scarcity, not effort or difficulty. It's a diagnostic point worth sitting with regardless: the party bearing the most physical, capital, and schedule risk in custom manufacturing is consistently the party capturing the least of what the transaction generates, and that pattern holds whether or not a platform sits in the chain at all. The shops that partially escape it do so by manufacturing scarcity for themselves, not by working harder at the same commodity work everyone else is already doing. Recognizing where custom manufacturing margin actually accrues, and why, is a prerequisite for any shop or manufacturing partnership trying to change its position in that chain even before getting to what changing that position would actually require.
This piece stops at the diagnosis on purpose. Redistributing margin, or even just understanding what a specific shop could realistically do to capture more of it, is a different and harder question than mapping where margin currently sits, and it deserves its own treatment rather than a rushed answer tacked onto this one. That next piece will need to grapple with something this one deliberately sidesteps: whether a fulfilling shop can move up the smile curve at all without becoming, in effect, a different kind of business entirely. If you want that piece when it's out, subscribe or follow along for the follow-up.